Mapping The Floor of Ladybird Lake
I used my solar powered autonomous boat equipped with a sonar depth sounder to collect depth measurements as it followed a predetermined path. I later put these data points into Matlab to create this visual plot. This is the third major mission I’ve sent the boat on, and by far the most successful. See other project sections for more information on the boat’s design.

Mission Video
In this video, I show off Gumption Trap’s most ambitious mission yet. I also analyze the collected data and comment on its operation.


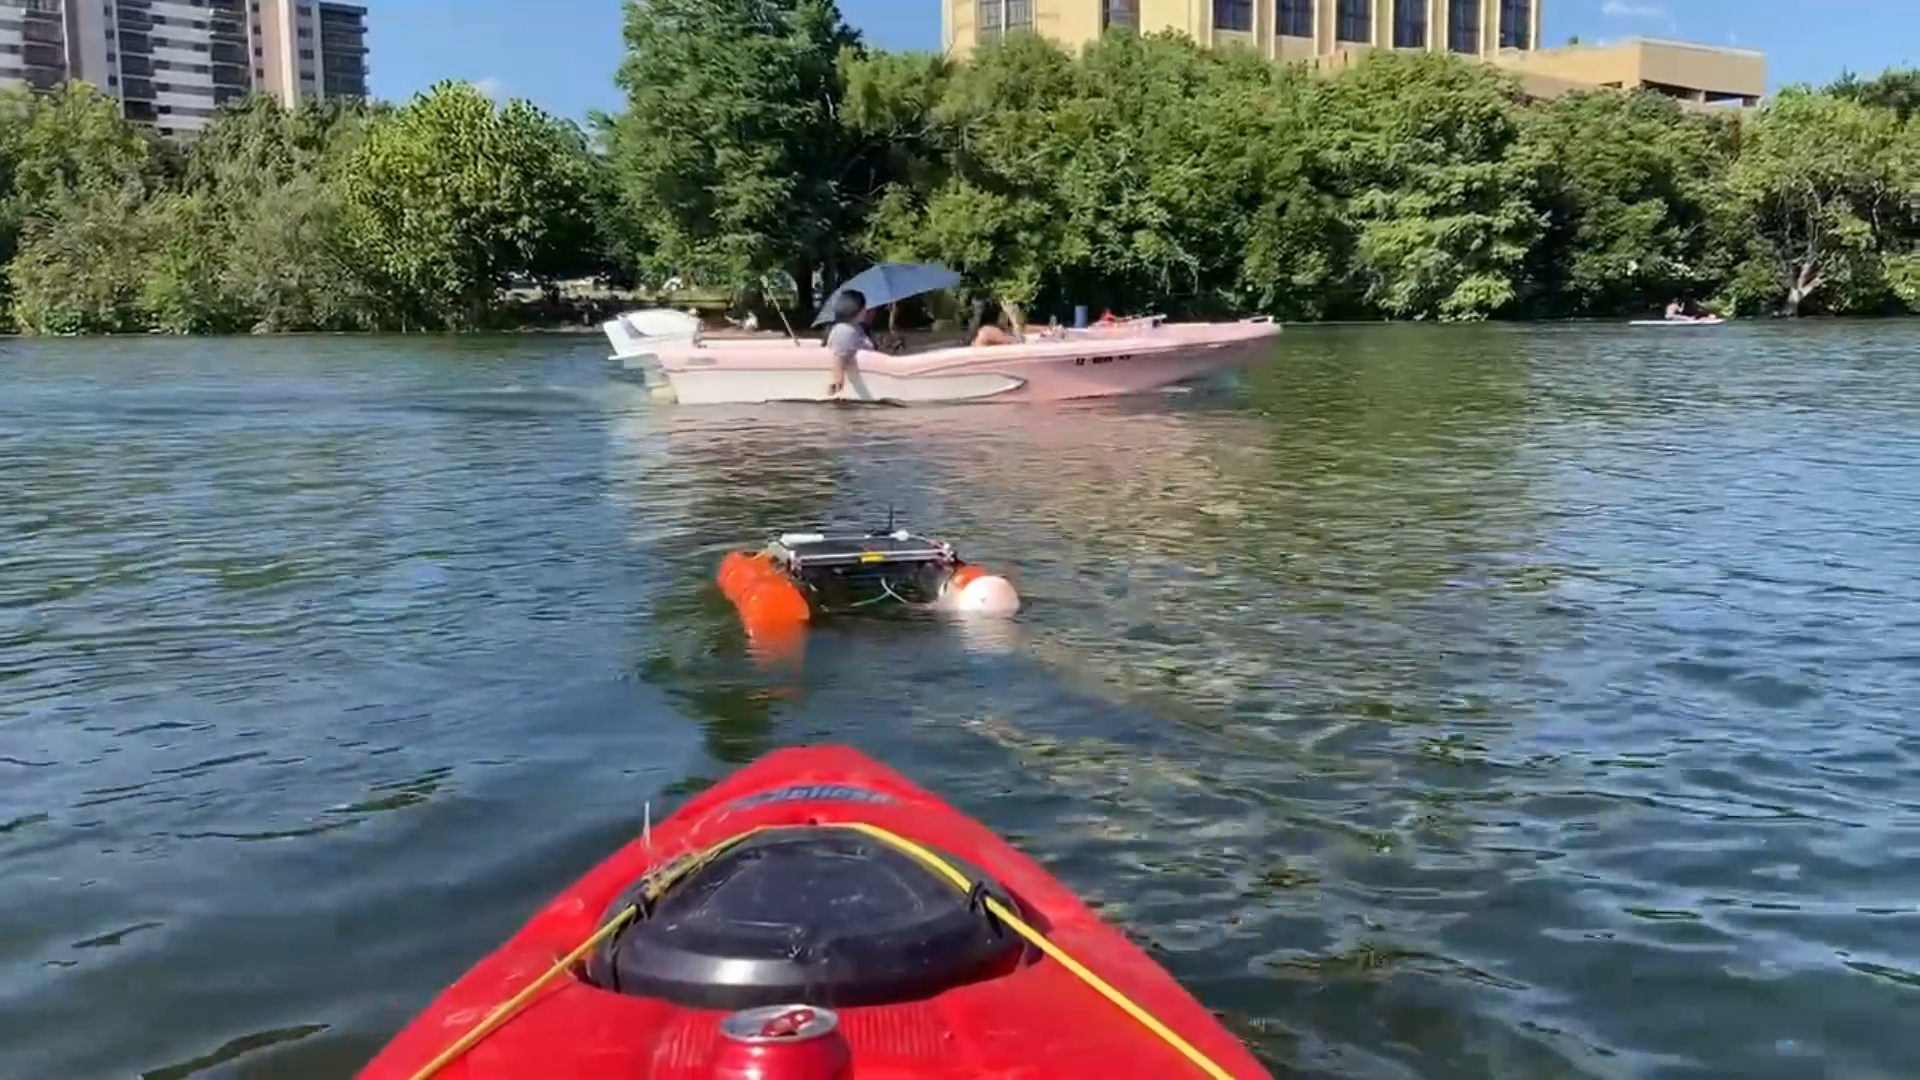
I gave the boat, Gumption Trap, a fresh coat of orange paint for this mission. This gave it some better visibility since it was operating in a busy area with paddle boarders and motorboats. It does not have any kind of autonomous collision avoidance, but I can take over manual control at any time with my radio transmitter. Also shown is my custom transportation stand.

The map shows an underwater valley, with the deepest point measured at approximately 25ft. Each black dot is a datapoint where depth was measured with the echo sounder. I create the map in Matlab by extrapolating a surface which intersects all the points.


Here is the depth plot overlaid onto a satellite image of the lake. Notably, the shallow (yellow) areas seem to align well with features on the shore. The deepest area (dark purple) appears to be right in the center of the wide part of the lake.

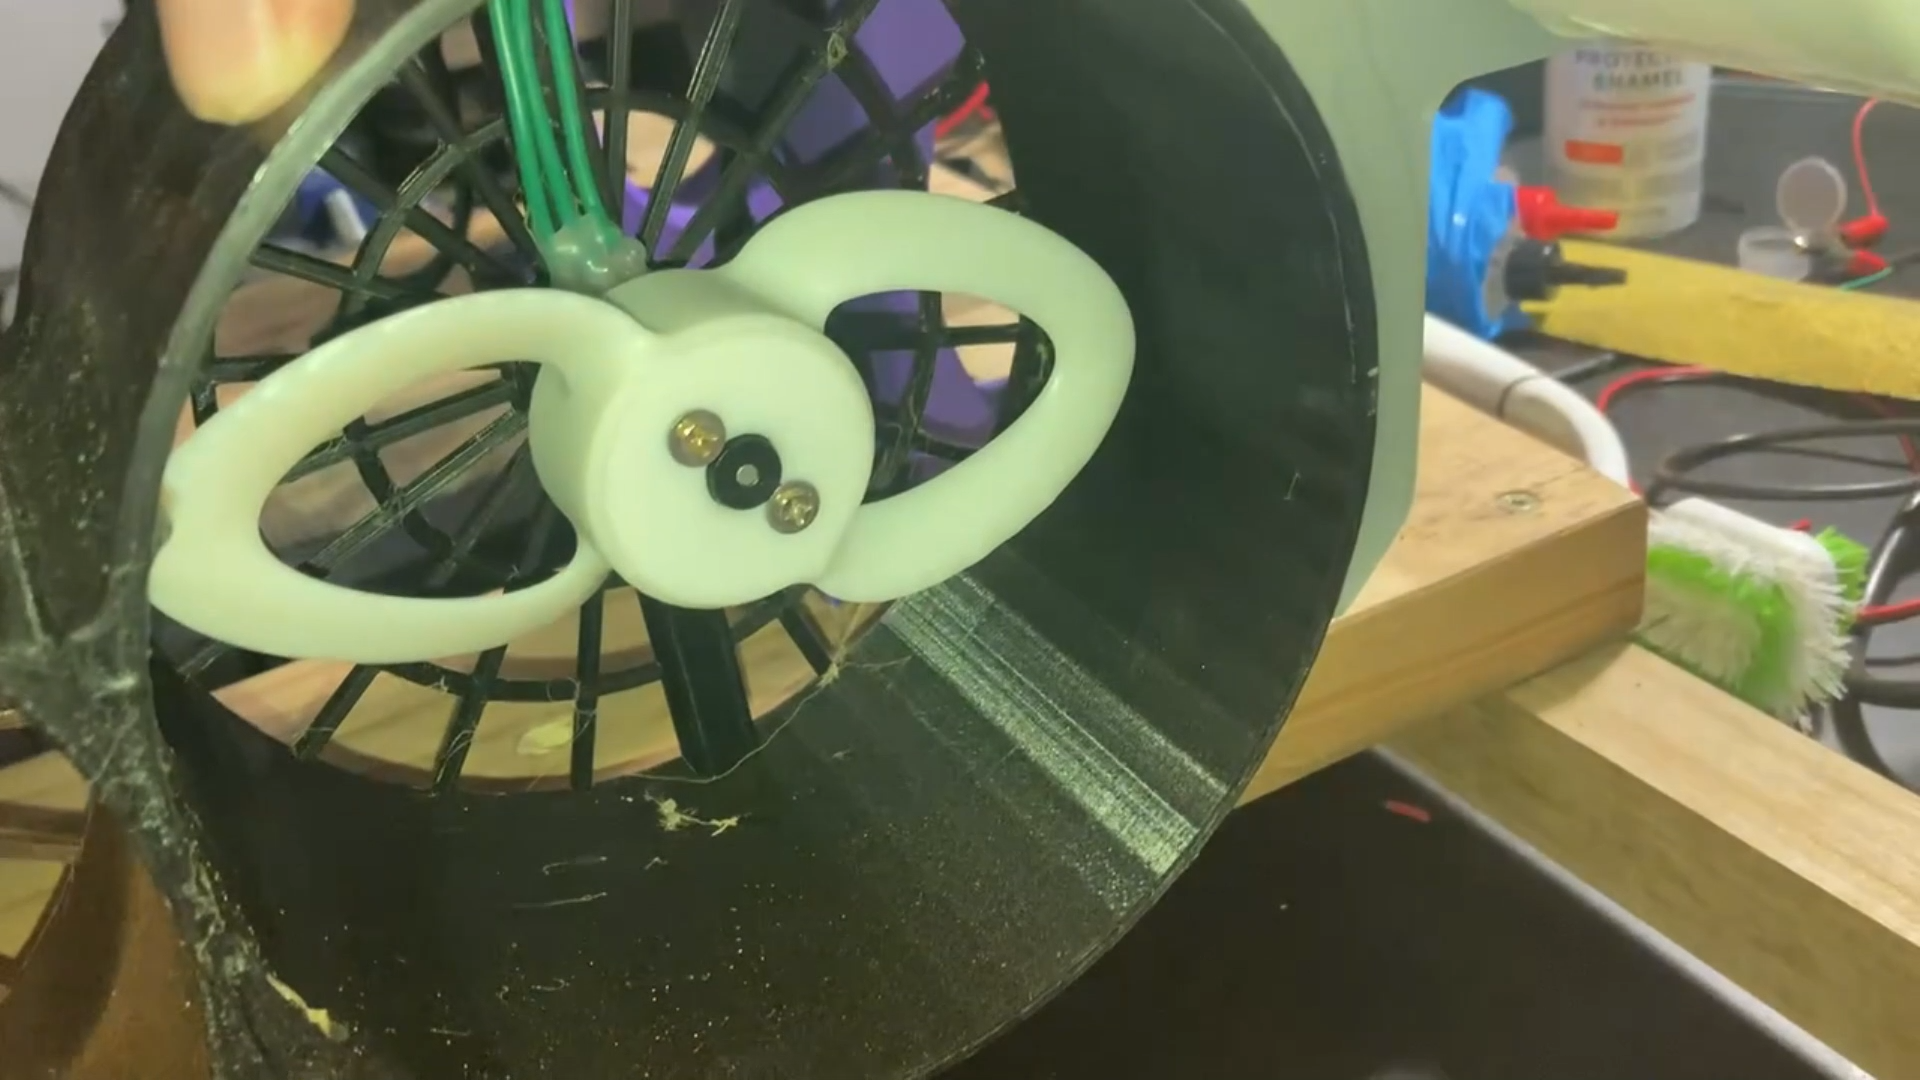
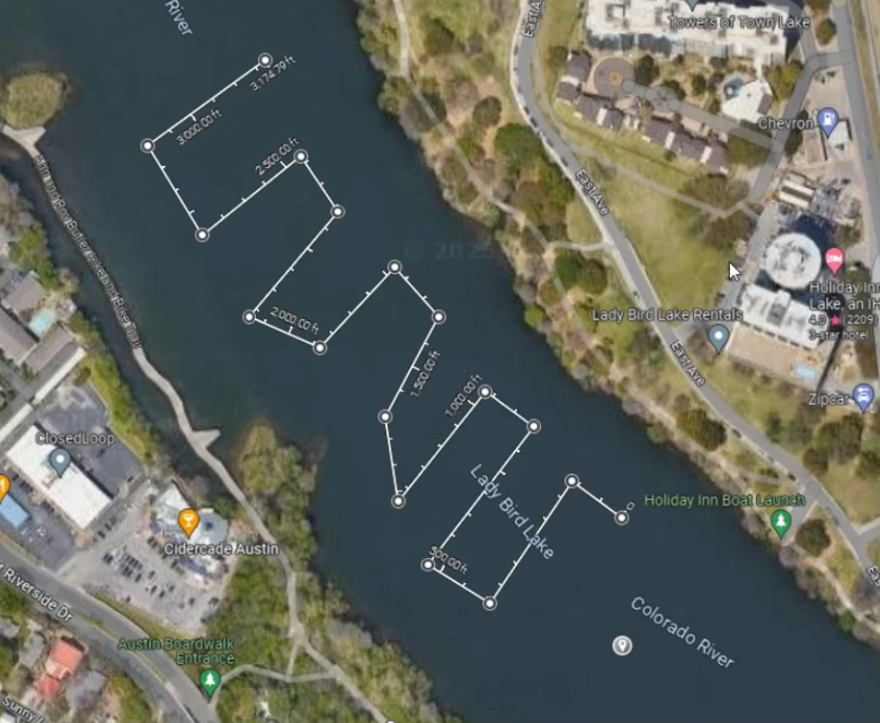
This plot shows the planned path (blue) compared to the actual path (black). The planned path is stored on an SD card in a CSV format containing coordinates of waypoints in order. The plot above drew a straight line between consecutive waypoints. The black line is actual measured GPS coordinates during the mission. There was a heavy crosswind present, causing the arc shape visible on each of the short zig-zag lengths. The boat dynamically adjusts its heading to keep itself pointed towards the waypoint. The chaotic area near the top left of this plot was caused by seaweed getting stuck in a propellor.


The boat records many different important parameters to a “black box” on its SD card. This data is extremely valuable to review for later troubleshooting. The plots above show current draw and battery voltage. During this mission, the solar panel did not quite keep up with the motors’ power consumption and the battery voltage gradually decreased.
These plots show the raw PWM signal that was being sent to each ESC, as well as the measured compass heading. This helps me verify that the steering logic is working correctly. During the next mission, I’ll add “goal heading” to the live data recording on the black box. This would allow me to compare goal heading to actual heading so that I could better tell if the steering is over/under damped, and allow for better PID tuning in the future. The steering is currently proportional only, adding an integral and derivative component would certainly help stay on course better.

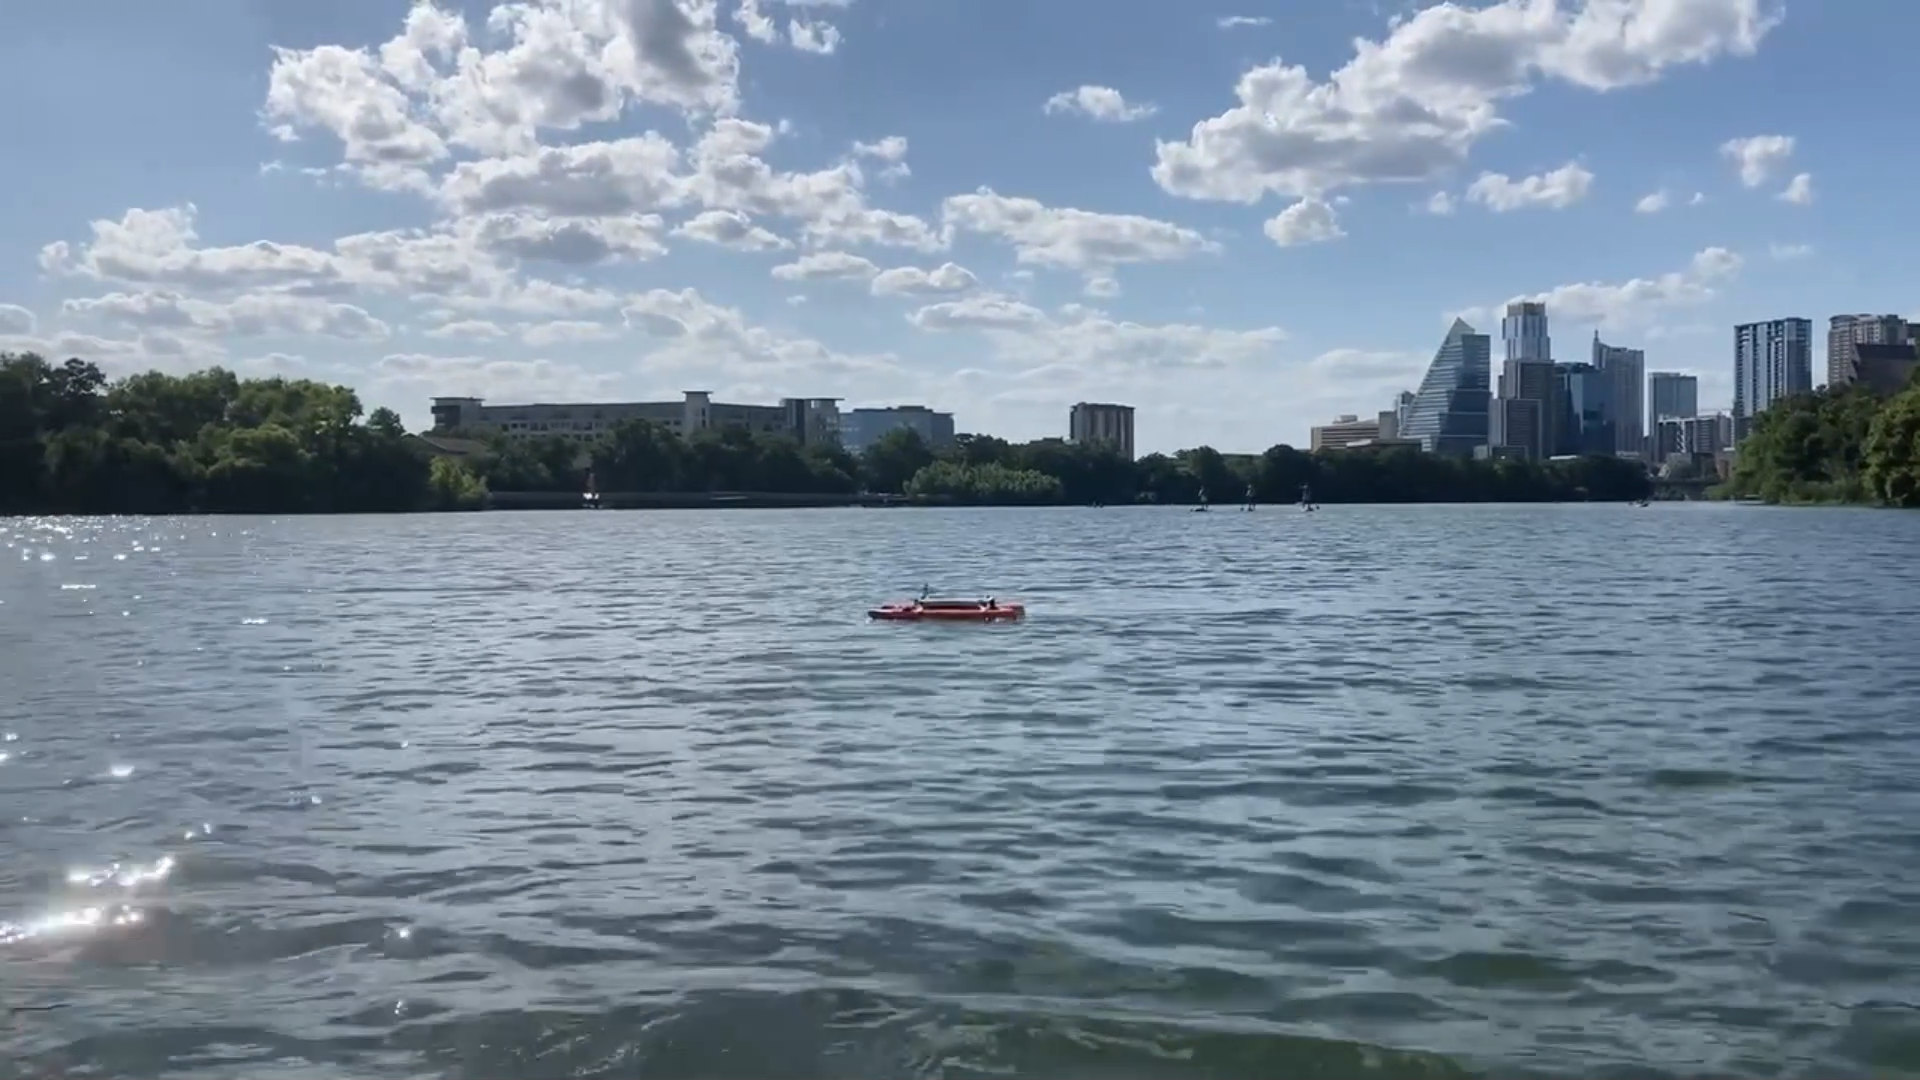
Gumption Trap showing off her impressive wake.