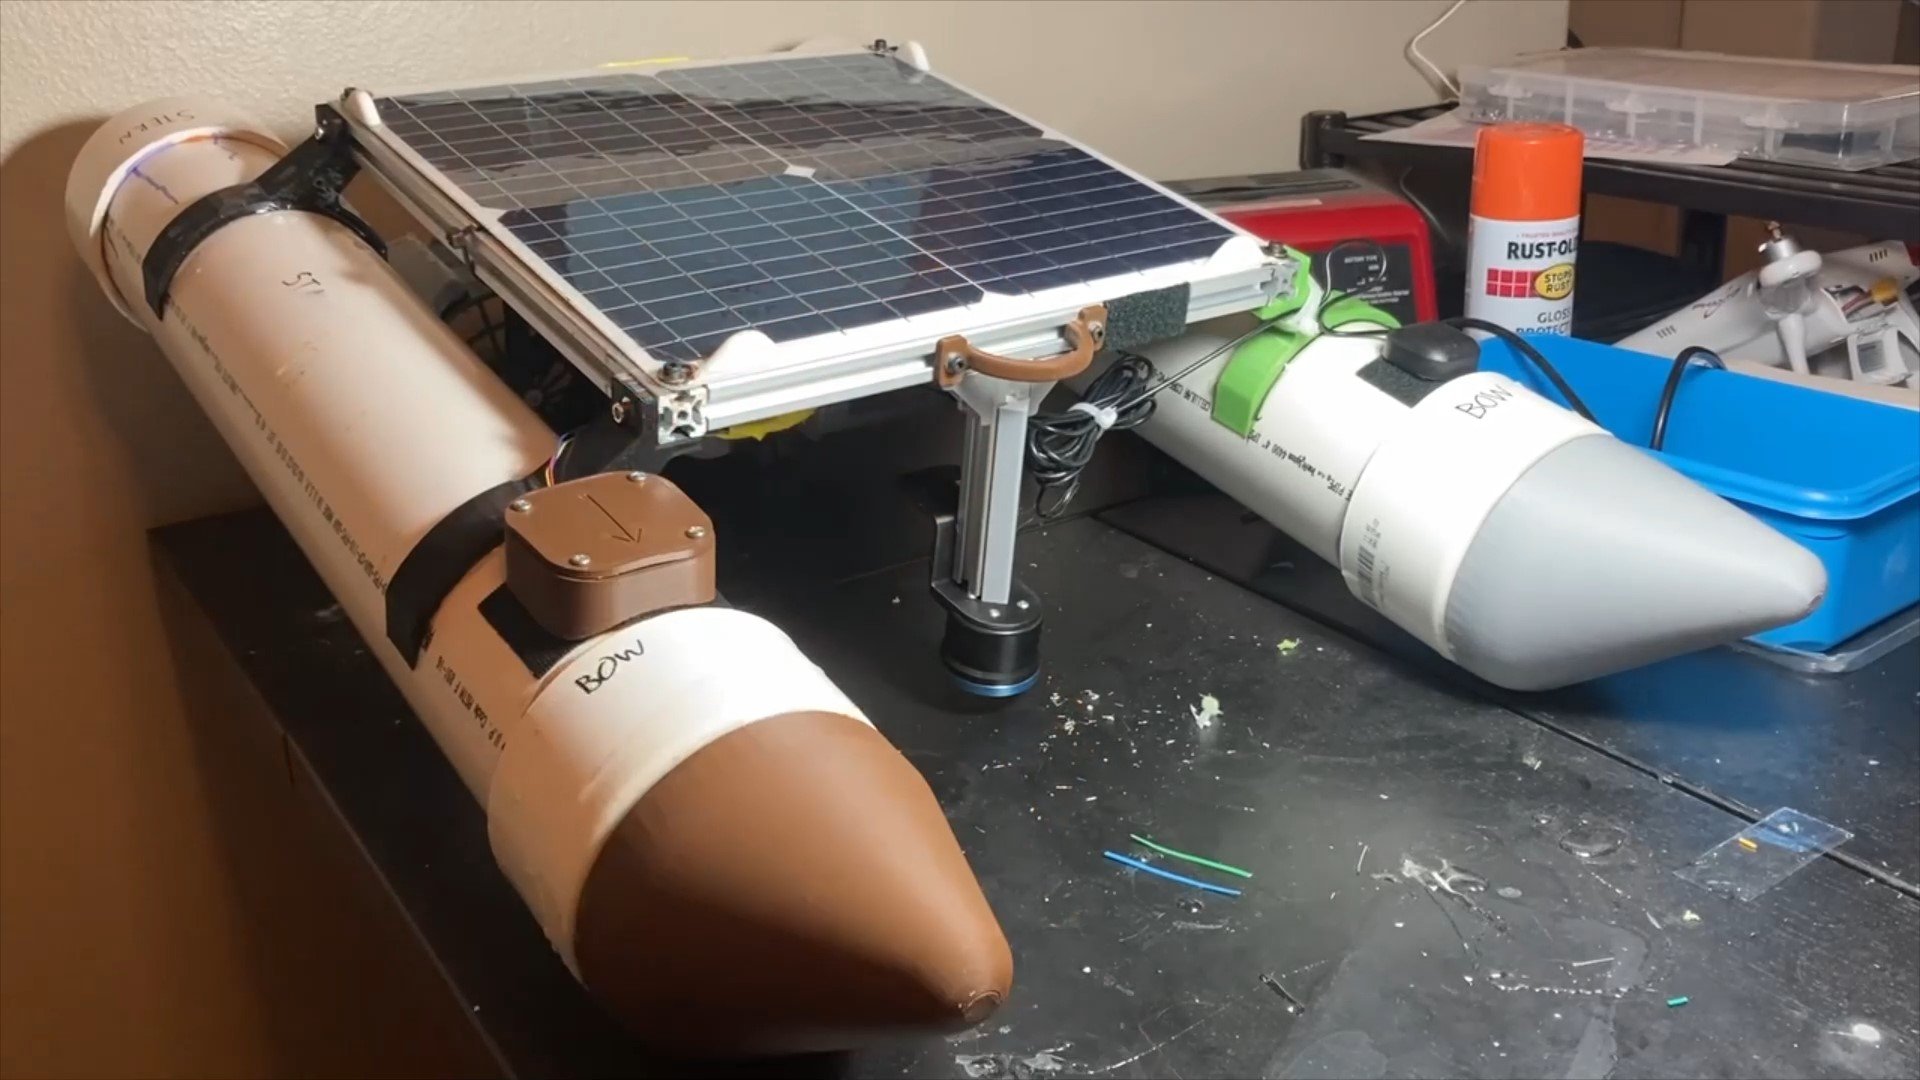
Autonomous Bathymetric Surveying “Gumption Trap” - Part 2
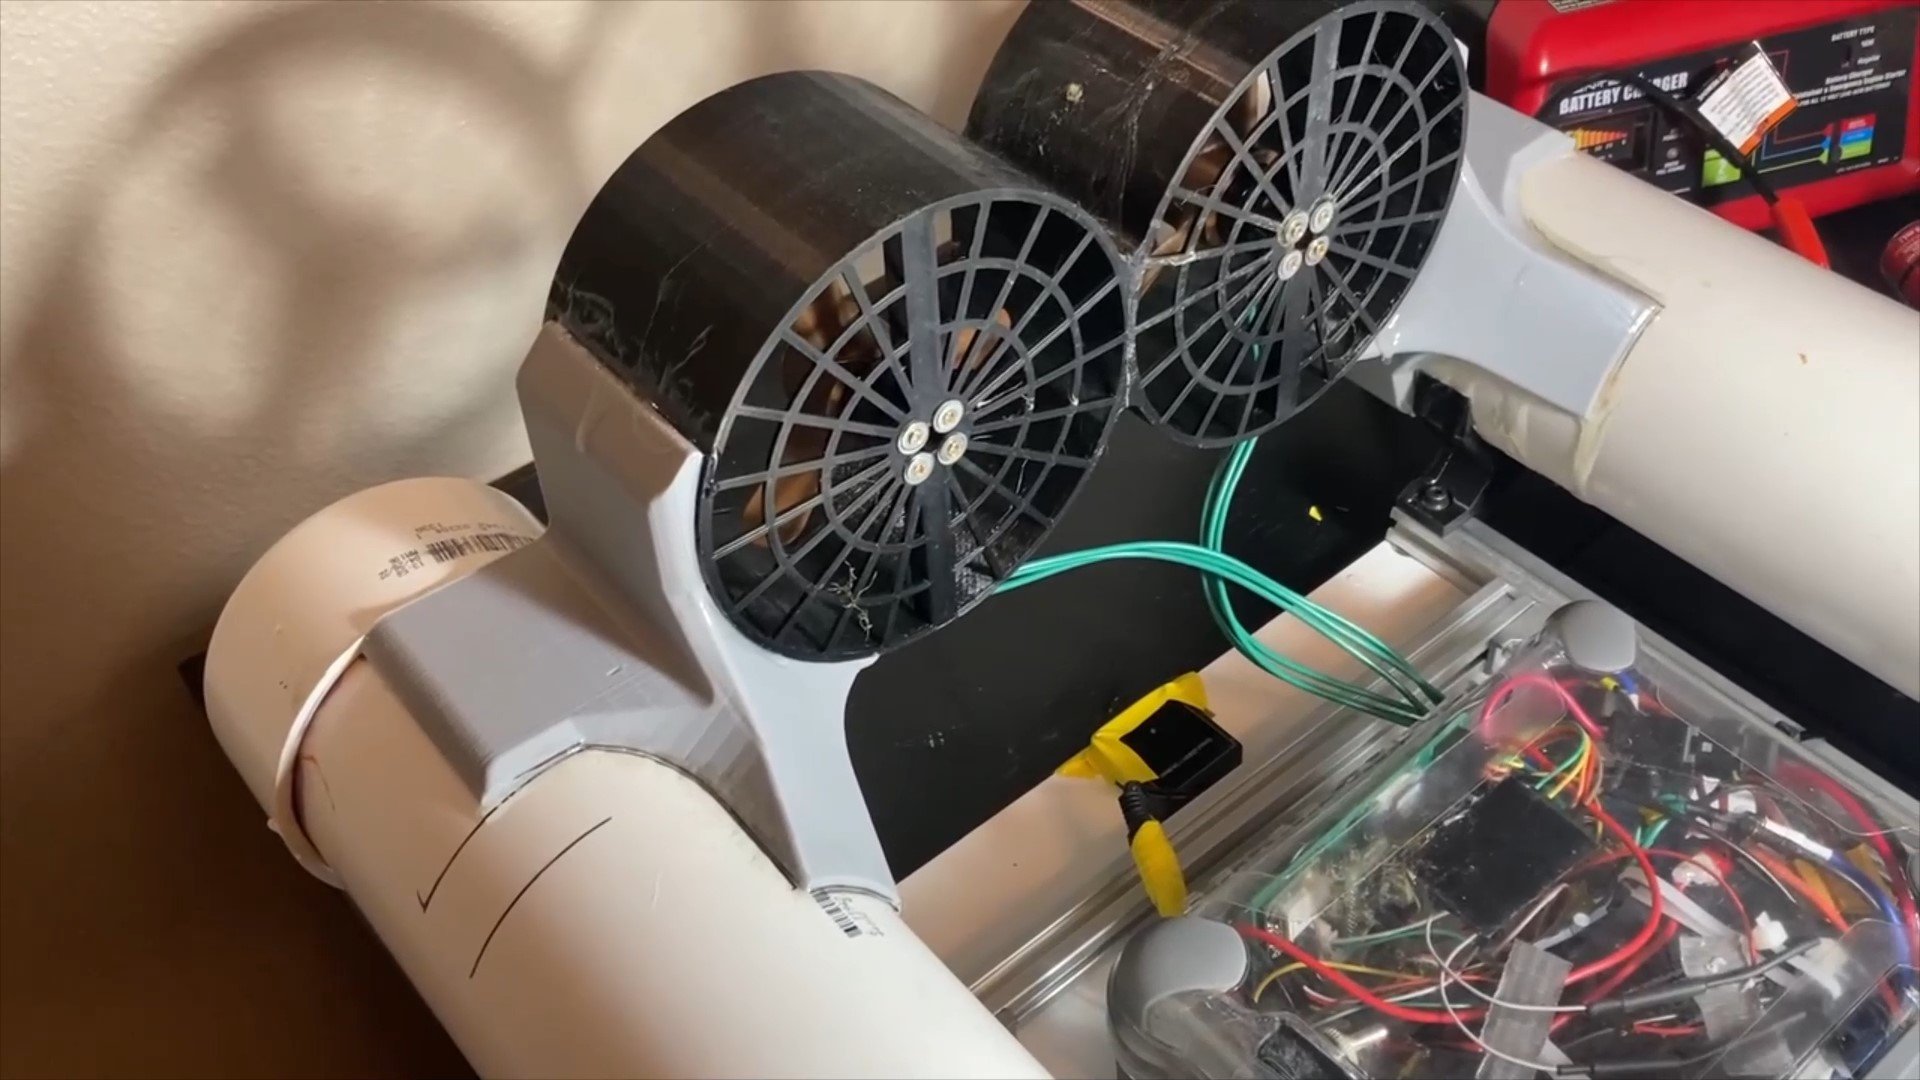
I added some functionality and other improvements to my self driving solar powered boat. The main addition is a sonar echo sounder altimeter. This allows the robot to take accurate depth measurements up to a depth of 50 meters.
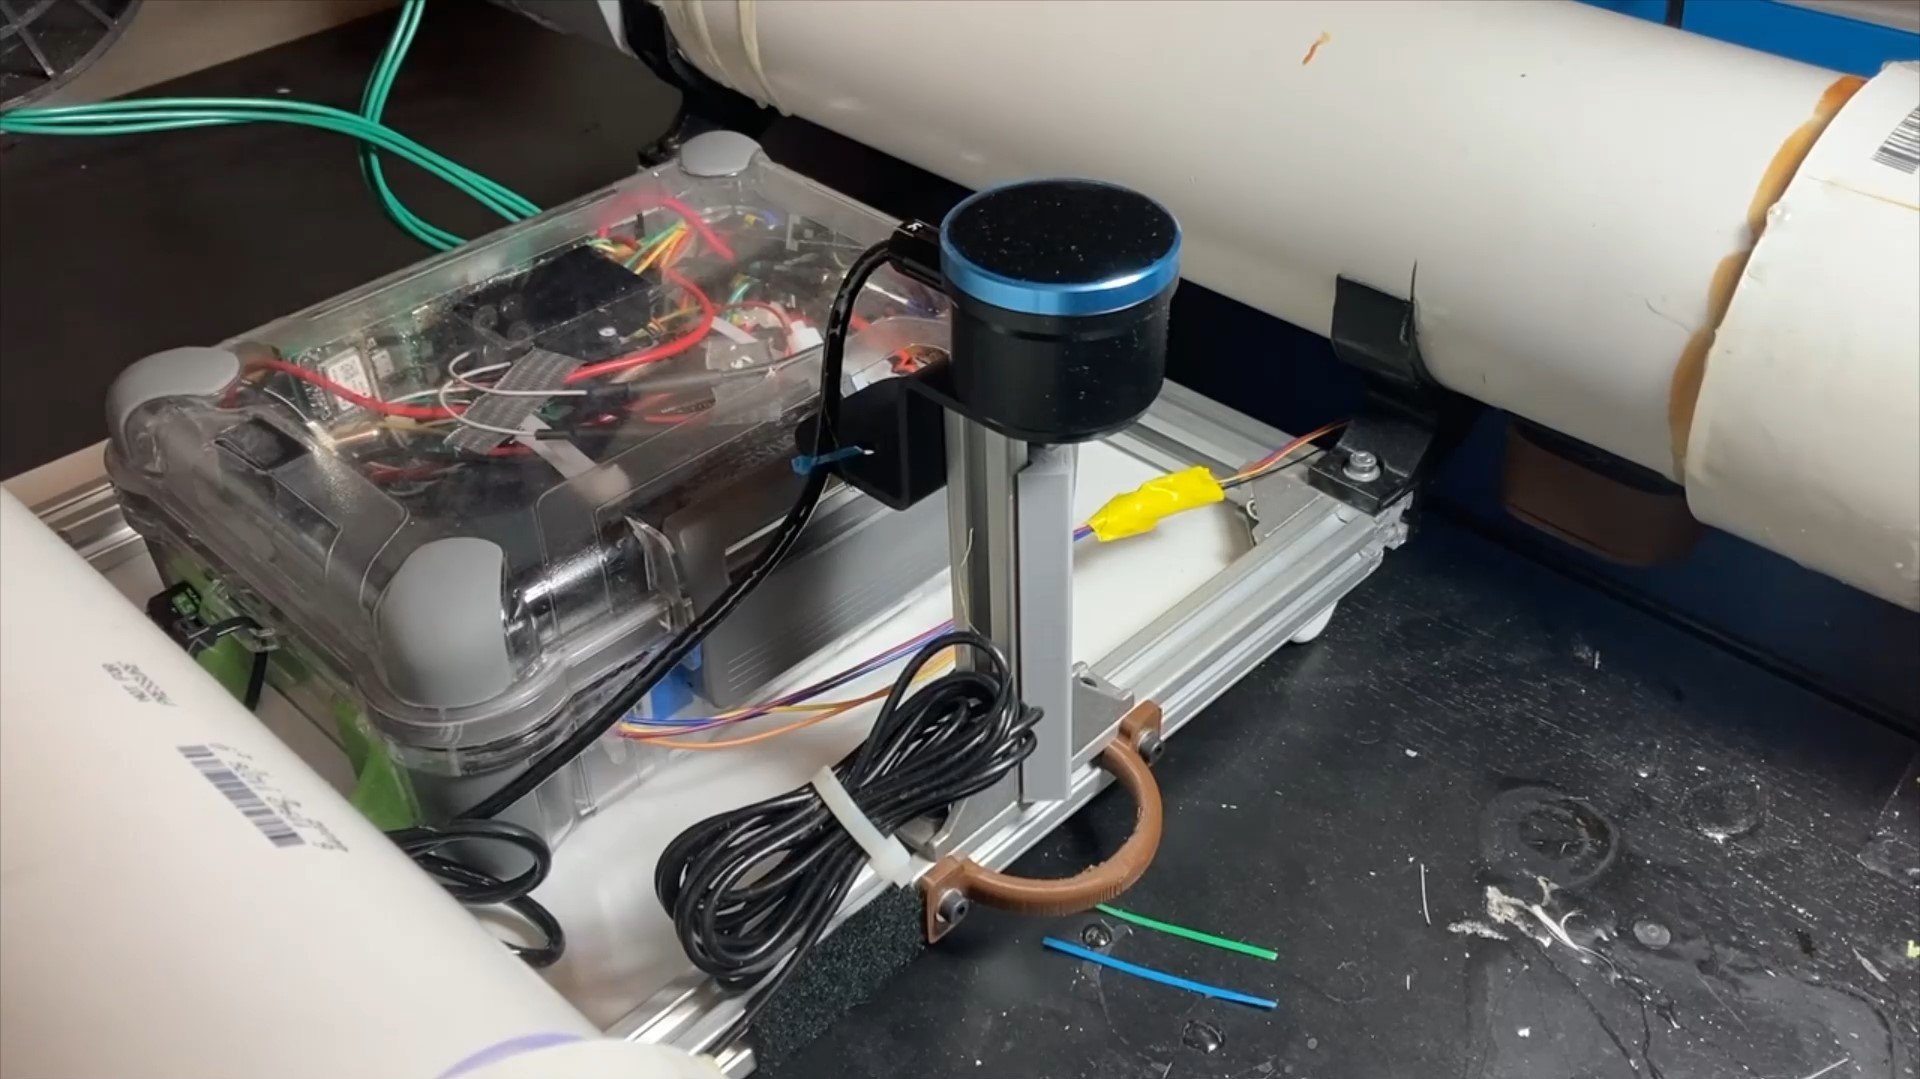
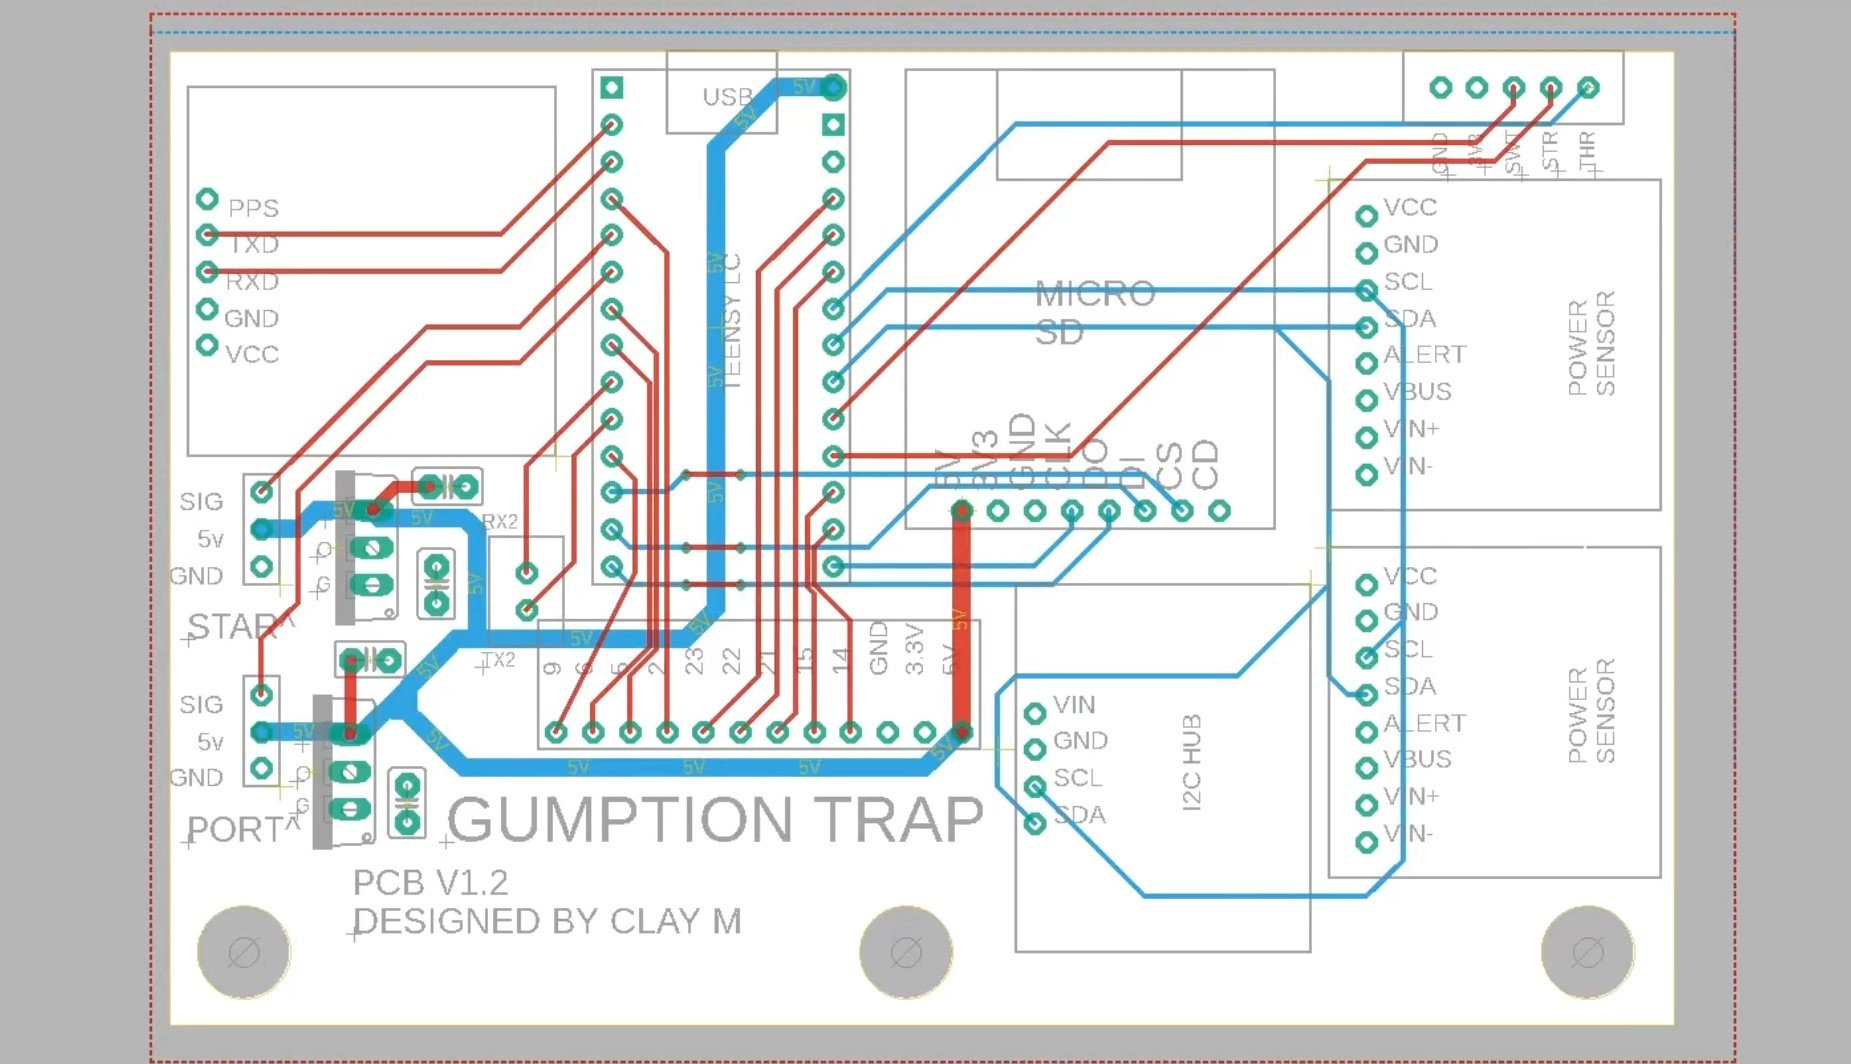
I also revamped the electronics to improve reliability and add data logging capability. This includes a custom PCB and a few new sensors. The robot plots point triplets of latitude, longitude, and water depth as it travels in the form of a CSV file. I later use MatLab to plot this data in 3 dimensions.
Here is a Github link where you can download the code I wrote which runs the boat, the code which generated the plots, and the schematics/board layouts I designed for the custom PCB.
Project Video
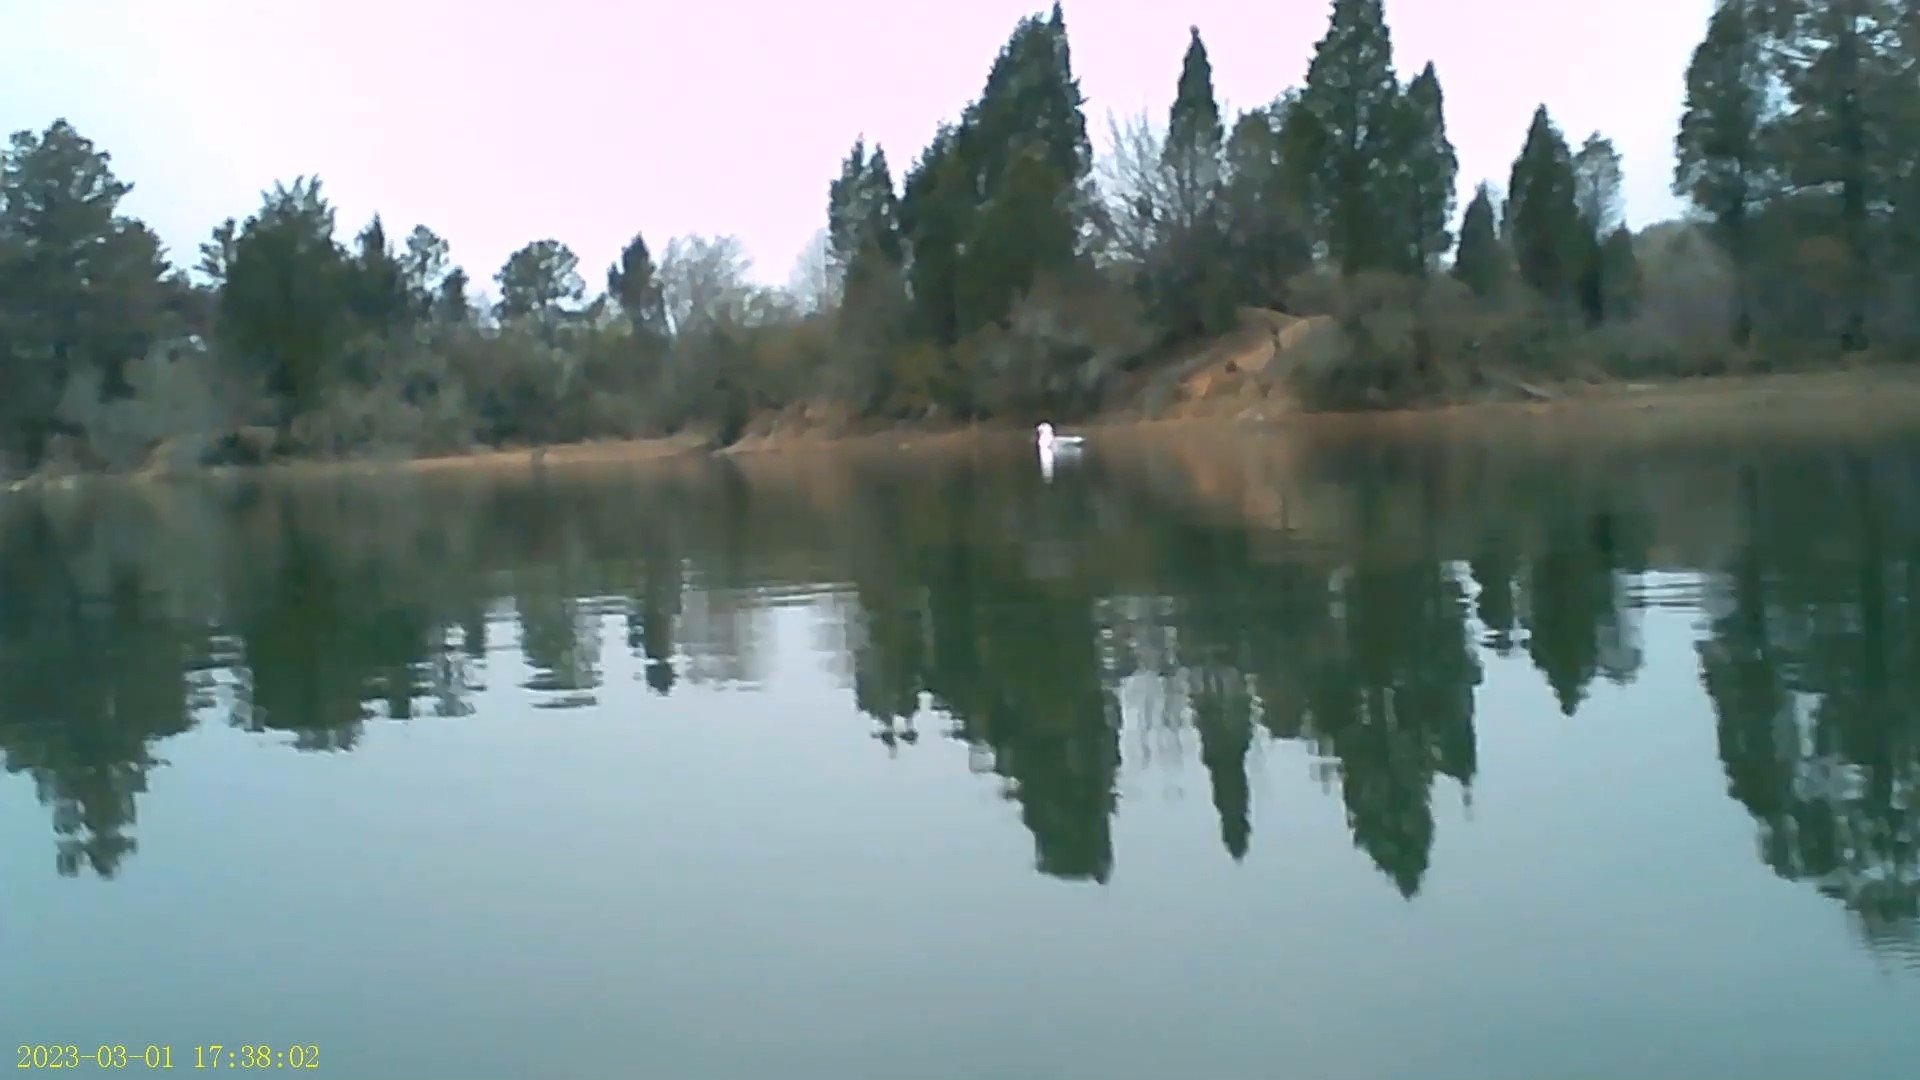
This video explains the upgrades I made since the last post. It also shows some footage and analysis of the first successful depth plotting run. This mission created a depth map of a local pond.


The latitude and longitude on this plot are not to scale. The black dots are the points where a depth measurement was taken. The line is the actual measured path that the robot followed. The color scale is in millimeters, with the maximum recorded depth being about 8.8m (29ft)
Depth Map
Raw Collected Data

This image shows the measured depth map approximately scaled to match a satellite image. The dock in the bottom left corner of the image is where the boat was launched from and returned to.
Depth Map vs Satellite Image

This image shows the measured GPS coordinates approximately scaled to match a satellite image overlaid with the planned path. The loops on the right side of the actual path were due to a bug in the code which didn’t correctly determine whether to turn clockwise or counter clockwise if the difference between goal heading and measured heading was less than -180®. This data, along with the raw black-box data, was extremely helpful for troubleshooting bugs and optimizing the code.
Planned Path vs Actual Path

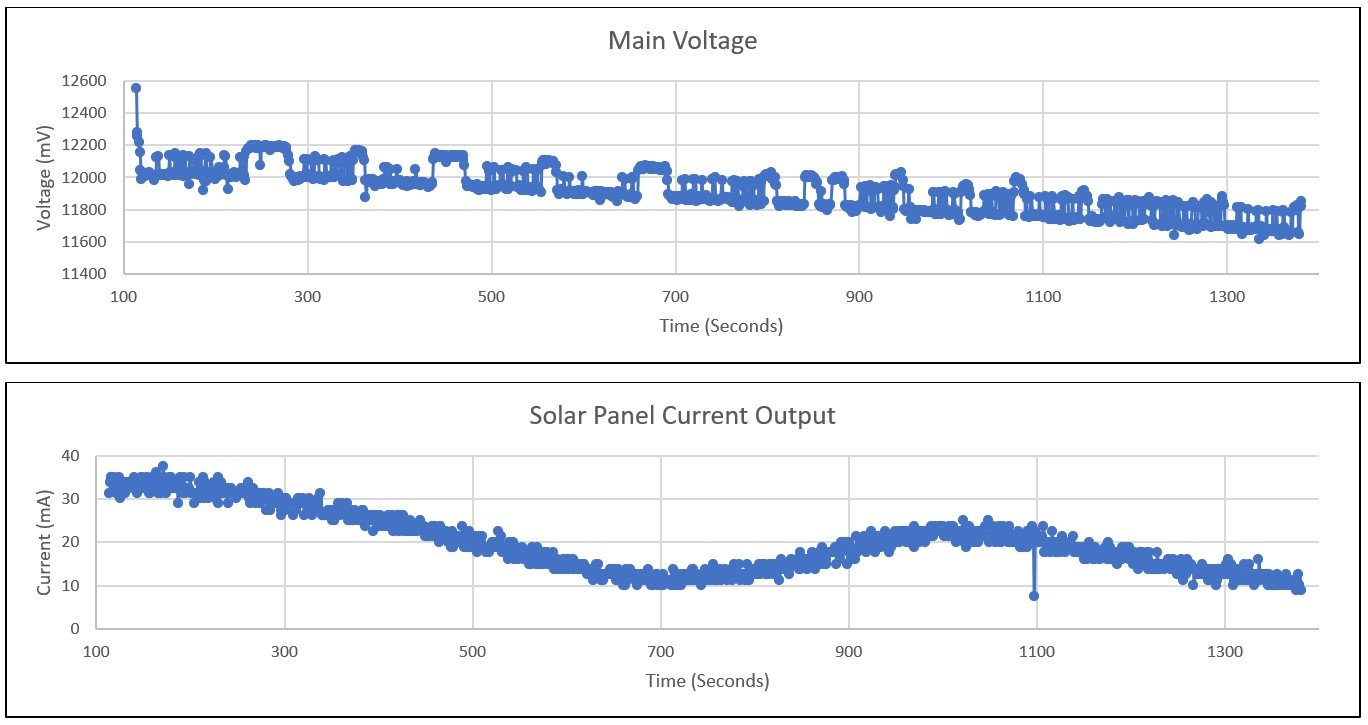
Black-Box Data Charts
These are some plots of a few interesting parameters from the recorded black box data during the mission. See the project video for some analysis and other thoughts about these data.